ヒストグラムマッチングとは
ヒストグラムから累積分布関数を作成して、2つの累積分布関数$S$と$G$について、$S(r)=G(z)$となるように$r$を$z$にマッピングするらしいです。参考:Wikipedia : Histogram matching
実施1
1つ目の画像の色を2つ目の画像の色に変換します。

コードはほとんどscikit-imageのサンプルコードの写経です。
import numpy as np
from PIL import Image
from matplotlib import pyplot as plt
from skimage.transform import match_histograms

referenceimage = Image.open("reference.jpg")
reference=np.asarray(referenceimage)

srcimage = Image.open("src.jpg")
src = np.asarray(srcimage)

matched = match_histograms(src, reference, multichannel = True)

fig, (ax1, ax2, ax3) = plt.subplots(nrows=1, ncols=3, figsize=(8, 3),
                                    sharex=True, sharey=True)
for aa in (ax1, ax2, ax3):
    aa.set_axis_off()

ax1.imshow(src)
ax1.set_title('Source')
ax2.imshow(reference)
ax2.set_title('Reference')
ax3.imshow(matched)
ax3.set_title('Matched')

plt.tight_layout()
plt.show()
結果1
次のような結果になりました。
個人的には植物の葉の部分がもっと紅くなるかと思ったのですが、そうはなりませんでした。
実施2
先ほどは画像のRGBそれぞれに対してヒストグラムマッチングを行いましたが、より人間の直感に近そうなHSV色空間に変換してからヒストグラムマッチングをしたらどうなるか見てみました。import numpy as np
from PIL import Image
from matplotlib import pyplot as plt
from skimage.transform import match_histograms
def RGBtoHSV(r, g, b):
r = int(r)
g = int(g)
b = int(b)
max = r if r > g else g
max = max if max > b else b
min = r if r < g else g
min = min if min < b else b
h = max - min
if h > 0:
if max == r:
h = 60 * ((g - b) / h)
if h < 0.:
h += 360
elif max == g:
h = 60 * ((b - r) / h) + 120
else:
h = 60 * ((r - g) / h) + 240
s = max - min
if max != 0.:
s = s / max
s = s * 100
v = max / 255 * 100
return h, s, v
def HSVtoRGB(h, s, v):
max = v * 255 / 100
min = s
min = min * max
min = min / 100
min = max - min
if h >= 0 and h < 60:
r = max
g = (h / 60) * (max - min) + min
b = min
elif h >= 60 and h < 120:
r = (120 - h) / 60 * (max - min) + min
g = max
b = min
elif h >= 120 and h < 180:
r = min
g = max
b = (h - 120) / 60 * (max - min) + min
elif h >= 180 and h < 240:
r = min
g = (240 - h) / 60 * (max - min) + min
b = max
elif h >= 240 and h < 300:
r = (h - 240) / 60 * (max - min) + min
g = min
b = max
else:
r = max
g = min
b = (360 - h) / 60 * (max - min) + min
return r, g, b
referenceimage = Image.open("reference.jpg")
reference=np.asarray(referenceimage)
referencehsv = np.asarray([RGBtoHSV(reference[i,j,0], reference[i,j,1], reference[i,j,2]) for i in range(reference.shape[0]) for j in range(reference.shape[1])], dtype = np.float)
referencehsv = referencehsv.reshape(reference.shape)
srcimage = Image.open("src.jpg")
src = np.asarray(srcimage)
srchsv = np.asarray([RGBtoHSV(src[i,j,0], src[i,j,1], src[i,j,2]) for i in range(src.shape[0]) for j in range(src.shape[1])], dtype = np.float)
srchsv = srchsv.reshape(src.shape)
matchedhsv = match_histograms(srchsv, referencehsv, multichannel = True)
matched = np.asarray([HSVtoRGB(matchedhsv[i,j,0], matchedhsv[i,j,1], matchedhsv[i,j,2]) for i in range(matchedhsv.shape[0]) for j in range(matchedhsv.shape[1])],dtype = np.uint8)
matched = matched.reshape(matchedhsv.shape)
fig, (ax1, ax2, ax3) = plt.subplots(nrows=1, ncols=3, figsize=(8, 3),
sharex=True, sharey=True)
for aa in (ax1, ax2, ax3):
aa.set_axis_off()
ax1.imshow(src)
ax1.set_title('Source')
ax2.imshow(reference)
ax2.set_title('Reference')
ax3.imshow(matched)
ax3.set_title('Matched')
plt.tight_layout()
plt.show()
結果2
次のような結果になりました。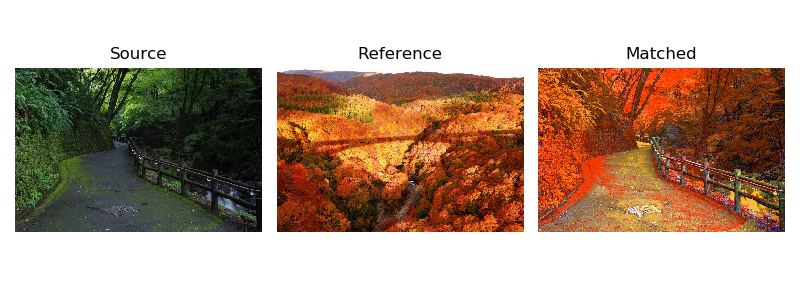
全体の色の分布しか見ないで変換しているため違和感はありますが、結果1よりは紅葉っぽい色合いになった気がします。
違和感なく画像の色を自動で変えるにはもっと複雑な処理が必要そうですが、これだけでも手軽に動かせて面白いと思いました。
0 件のコメント:
コメントを投稿